


November 6, 2023
At Unlearn, we invented the concept of using patients’ digital twins to improve clinical trials. Not only have we invented numerous machine learning and statistical methodologies, we’ve also blazed the trail for applying these methods in late stage clinical trials in ways that regulators will accept—even going through a two year process to obtain a novel methodologies qualification opinion from the European Medicines Agency. Nevertheless, we continue to encounter some common misconceptions about how we actually use trial participants’ digital twins to improve clinical trials. That’s one of the inevitable downsides of inventing products based on sophisticated mathematics, I suppose. Let’s see if we can clear up some of those misconceptions in this post.
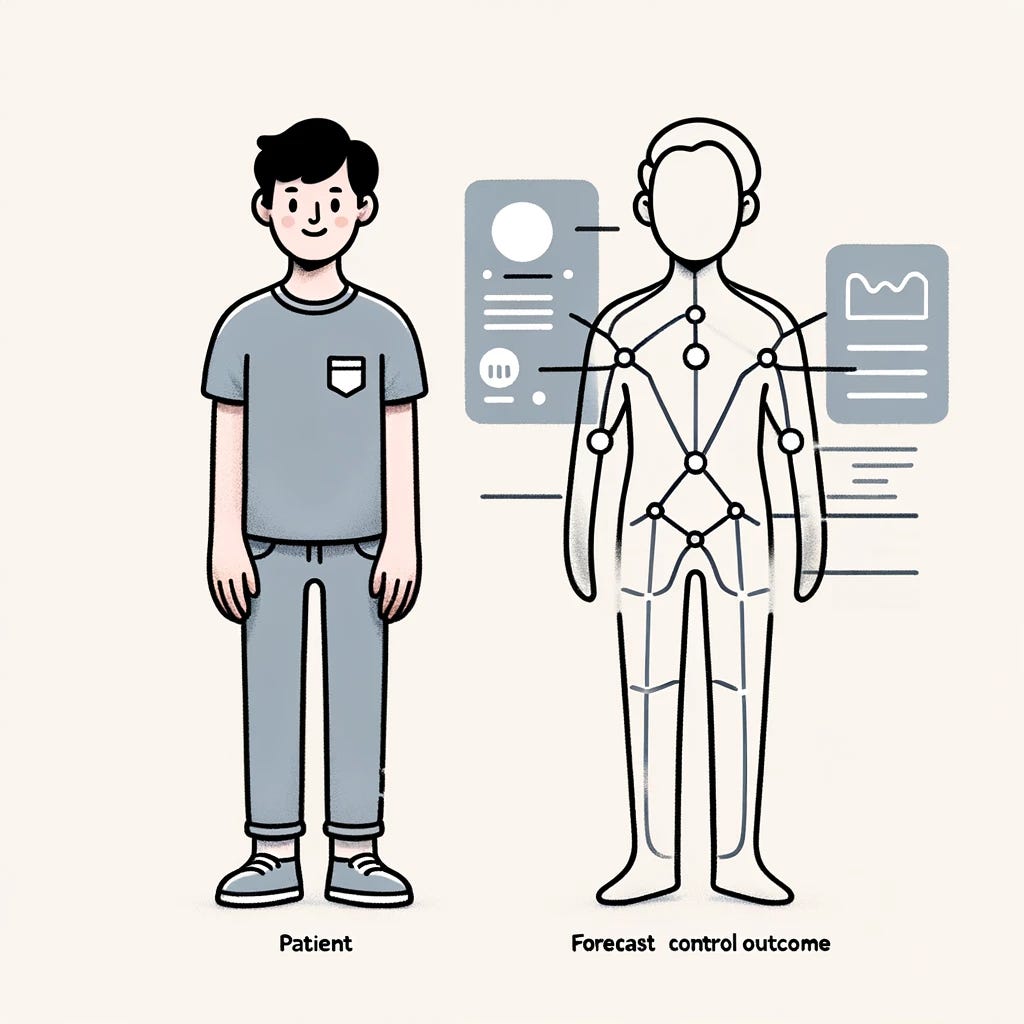
First and foremost, when we refer to a patient’s digital twin we mean that we’re using a model to forecast that individual person’s health in the future. These models are trained on historical patient data then applied to generate forecasts for new patients. In the context of a clinical trial, we start with a pre-specified model trained on historical data, then we collect data from a participant in the trial at their first visit as usual (their “baseline variables”), and input their baseline variables into the pre-specified model so that it can forecast their future clinical outcomes over the course of the trial. Since our models are trained on historical data from patients in the control groups of previous clinical trials and similar observational studies, a participant’s digital twin forecasts what their clinical outcomes would be if they were assigned to the control group.
So, a participant’s digital twin is not data from a matched patient in the historical dataset. In fact, it is not like a new patient at all; rather it is a model based forecast for the future clinical outcomes of a specific trial participant. However, it does not forcast how that specific participant will respond to the experimental treatment, only how they would likely respond if assigned to the control group. The models that we use to create these forecasts are based on deep neural networks, they are not mechanistic models that aim to describe all of the complexity of the human body. This coarse graining means there must be uncertainty in the model’s forecasts, and we do calculate prediction intervals to estimate that uncertainty.
“Okay. Okay. A patient’s digital twin is a forecast. We get it. Stop beating a dead horse. But, what I really care about is clinical trials. How do you actually use forecasts like this to make clinical trials better?”
Alright, I got you.
In short, the forecast clinical outcomes are included as covariates in an adjusted analysis to estimate the treatment effect. Why do it this way? To quote from the FDA’s guidance on covariate adjustment, “Covariate adjustment leads to efficiency gains when the covariates are prognostic for the outcome of interest in the trial. Therefore, FDA recommends that sponsors adjust for covariates that are anticipated to be most strongly associated with the outcome of interest.” Guess what variable maximizes the correlation with the outcome of interest—a forecast for the outcome! That’s why some authors have started referring to our work as using “super covariates”.
Although covariate adjustment is widely used in clinical trials—e.g., adjusting for variables that are used in stratification—it’s not particularly easy to explain how it works without using some math. I’m going to give it a try, but first I’d like to debunk another common misconception that is not how it works.
To set the stage, imagine that you are planning a clinical trial with 1000 participants and 1-to-1 randomization so that 500 participants will be randomly assigned to the treatment group and 500 participants will be randomly assigned to the control group. But, then you come across this incredible company Unlearn.AI and learn that by applying their digital twin technologies you could run a trial with the same power that only needs to enroll 800 participants—500 participants will be randomly assigned to the treatment group (just like the original plan) but only 300 participants will be randomly assigned to the control group. The trial that uses participants’ digital twins can reach the target enrollment much faster because it doesn’t need to enroll as many participants to reach the designed power, and it does this in a patient-centric way by reducing the fraction of participants who are randomized to the control group. Note that I’m just using round numbers here for the example; the actual design for a given trial requires some calculations.
Now, almost everybody hears that story above and thinks we add 200 digital twins into the control arm somehow. But that is not how it works.
I understand why this misconception is appealing. You started with 500 participants on treatment and 500 on control, and now you have 500 on treatment and 300 on control. It’s like there are two glasses of water, one representing the treatment group and the other representing the control group. The glass representing the treatment group is full, but the glass representing the control group is only partly full. So, naturally one constructs a picture in which we somehow fill it up with digital twins.

This picture is too appealing! And it’s wrong! Wrong. Wrong. Wrong.
To understand why this picture is wrong, I’ll need to try to explain how prognostic covariate adjustment works in randomized trials. I think I can do this without any math, so stick with me.
Randomized trials are used to assess causality. Does taking this treatment cause a change in the outcome? We can evaluate questions like this using a framework known as “potential outcomes”.
Imagine a participant in a clinical trial as a contestant on a game show. There are two doors, one labeled “treatment” and the other labeled “control”. Behind each door is a “potential outcome”. If the participant is assigned to the treatment group, then we will open the door labeled treatment to reveal their potential treatment outcome. On the other hand, if they are assigned to the control group, then we will open the door labeled control to reveal their potential control outcome. It’s important to note that we can only open one door for each participant; the outcome behind the other door remains hidden. So, we can’t say whether or not the outcome behind the door labeled treatment was better than the outcome behind the door labeled control, because we never get to see behind both doors. But, if we enroll enough participants in the trial, and we randomly decide which door to open for each participant, then we can estimate the average difference between the treatment and control outcomes in the population eligible for our trial. That’s roughly how randomization works in clinical trials.

The outcome behind each door changes for each participant. Some participants’ would have a poor outcome if we opened the door labeled control, but others would have a good outcome. We can’t know for sure, but we can use a model to predict what outcome is behind the door labeled control for each participant. That’s what their digital twin provides.
For comparison, imagine that we changed the rules of the game show so that we always open the door labeled treatment for every participant. Everybody gets the treatment! But, we never get to see what’s behind any of the doors labeled control. So, how do we know if the treatment is actually better than the control? One possibility would be to use each participant’s digital twin to predict the outcome behind the door labeled control, and then compare those predicted control outcomes to the observed treatment outcomes.
The problem with this “single arm” design is that our estimate for the treatment effect would be equal to the true treatment effect plus the bias in the model’s predictions. How do we know that the model isn’t biased, you ask? We don’t. So, then how can you trust the estimate for the treatment effect, you say? Well, to be honest, you really can’t.
But, in a randomized trial, you do open the door labeled control for some of the participants which means you can compare their observed control outcome with what their digital twin predicted. This makes it possible to measure the bias in the model’s predictions, and correct for it when we estimate the treatment effect. That’s what prognostic covariate adjustment does.
I know I said I wasn’t going to use any math … but I lied. Don’t worry though, it’s simple math. In the single arm trial, we tried to estimate the treatment effect by looking at the mean difference between the observed treatment outcome and the predicted control outcome for the participants who received the treatment, but found that this included bias from the prediction model:
treatment effect + bias = mean_{treated} (treatment outcome - predicted control outcome)
With prognostic covariate adjustment, we use all of the data from the randomized study to debias our predictions for the control outcomes and then compute,
treatment effect = mean_{treated} (treatment outcome - debiased predicted control outcome)
The bias in the estimate for the treatment effect goes away!
Let’s reconsider our hypothetical 1000 participant clinical trial. However, since you’re working with Unlearn you only need to enroll 800 participants to achieve the same power. 500 of the participants are randomly assigned to the treatment group, and 300 participants are randomly to the control group. And, Unlearn uses data collected from each participant at their first visit to create 800 digital twins—one for each participant in the study. We use the participants’ digital twins to forecast their control outcomes. At the end of the study, after the data are unblinded, we perform a covariate adjusted analysis with all of the participants in order to debias the predicted control outcomes. Then, we estimate the average treatment effect as the mean difference between the observed treatment outcomes and the debiased predicted control outcomes for the participants in the treatment group.
The above description of covariate adjustment in randomized trials is pretty different from what you’ll read in many textbooks, but it is mathematically equivalent. And, as FDA says, “incorporating prognostic baseline covariates in the design and analysis of clinical trial data can result in a more efficient use of data to demonstrate and quantify the effects of treatment. Moreover, this can be done with minimal impact on bias or the Type I error rate.” So, you should be doing this. It makes your trial better.
Now, there is one remaining question that we always get asked at this point. You’re probably thinking, “I understand now that each participant gets a digital twin when they enroll. That their digital twin uses their baseline data to forecast what would happen if they got the control. And, we need to randomly assign some of the participants to the control group so that we can debias the predicted control outcomes at the end of the study in order to get an unbiased estimate of the treatment effect. But, how many participants need to be assigned to the control group to do this?”
It depends on how well one can forecast control outcomes in that indication. If the model used to forecast participants’ potential control outcomes has a high correlation with observed control outcomes, then we won’t need many observations to debias it. On the other hand, if the model used to forecast participants’ potential control outcomes has a low correlation with observed control outcomes, then we will need many observations to debias it. So the more correlated the forecast is with observed control outcomes, the fewer participants need to be assigned to the control group. We’ve derived a formula to calculate this precisely.
And, what if you already know something about how biased the model is? For example, based on its performance on some test data. Could you then design a study using even fewer participants? Yes! That’s how our Bayesian methods work. But that’s a topic for another blog post.


